Production key figures | Dashboards
Key figures in real time. Decisions based on facts.
KENEXOS® – Turning data into clarity.
Home | Solutions | Building and facility management | Production key figures and dashboards
The challenges of managing with production figures
The problems
Transparency is crucial in modern manufacturing environments – but performance data is often scattered in individual systems, Excel files or on paper.
Faults, output, OEE or downtimes are recorded with a delay or not evaluated at all.
This means that there is no basis for quick decisions, well-founded analyses and targeted improvements.
![]()
No standardized data basis for key production figures
Time-delayed or manual data acquisition
Lack of transparency regarding capacity utilization, downtimes, rejects and efficiency
No real-time visualization or automated evaluation
Media breaks between production, maintenance and management
High effort for reports, meetings and evaluations
The solution
KENEXOS® consolidates production data in a central system – directly from the plant, manually supplemented or via an interface to MES, PDA or IoT systems.
Key figures such as OEE, availability, performance, quality, fault frequency or throughput are automatically calculated, graphically processed and displayed in role-based dashboards.
This means that everyone involved – from shift supervisors to plant management – receives exactly the information they need.
The advantages of KENEXOS®
Central recording of all relevant key production figures
Real-time dashboards for teams, maintenance and management
Automatic calculation of OEE, MTTR, MTBF, availability and much more.
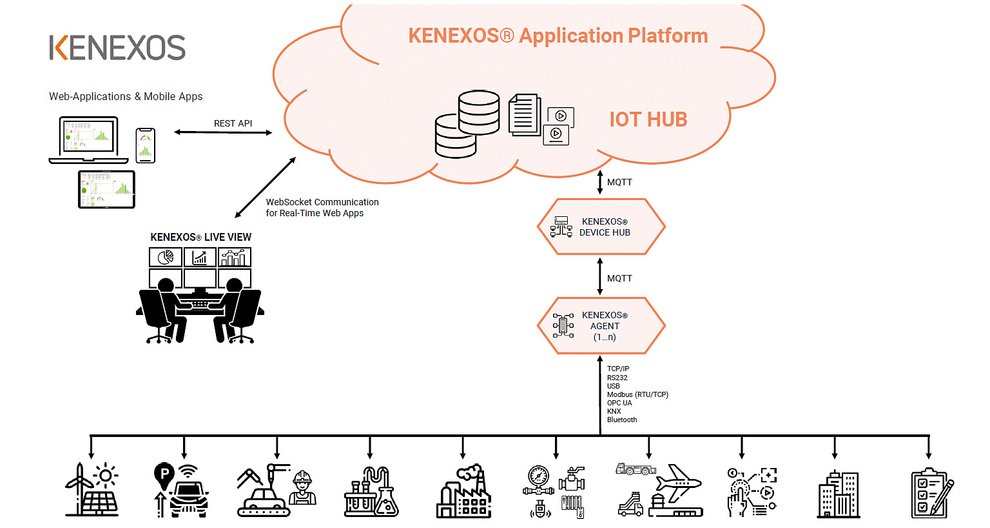
Connection to machines, IoT devices, MES/BDE systems
Visualization on store floor screens, tablets or control stations
Export functions for reporting, management and audits
Basis for continuous improvement and data-based decisions
KENEXOS® IoT / machine data acquisition
Main benefits: Competitive advantage and reduced costs
Industry 4.0 = networking of machines and IT
Information generated by a machine or measuring system can be divided into process data and product data.
Process data primarily comprises information that is generated during operation and reflects the status of a machine or measuring unit. This can be temperature, energy consumption, etc. It can be
In connection with the operation of a system, product data provides information about the production process, which can include quantities, weights and much more.
For data recording, a “data collector” is the link between the machine and the data backend. It has standardized interfaces and stores the values in a data archive with an optional cloud connection.
In addition to traceability, quality assurance and OEE key figures, the recorded values are the ideal input variables for energy monitoring or maintenance management, especially predictive maintenance.
Small companies and SMEs need to catch up
Industry 4.0 is currently primarily a topic for large companies. They have already successfully implemented various projects and achieved added value within a very short space of time. In small and medium-sized companies, Industry 4.0 (still) only plays a minor role. This must change if companies want to remain competitive in the future. There is a particular need for action in the areas of production, IT and research and development.
Networking and digitalization have arrived in the manufacturing industry and can give the manufacturing industry a huge boost in innovation: Production processes are becoming more dynamic and efficient.
TEST FREE OF CHARGE
Choose KENEXOS® today
Test all functions
14 days free of charge without restrictions!
Use the app immediately
on the computer, tablet or smartphone
Completely risk-free
Your access ends automatically!